We track every reported all-time high on the S&P 500 and on individual mega-caps, then measure the decline off that high. Cross a defined threshold — 10%, 20%, 30%, 40% — and the setup enters the watchlist. No threshold, no signal.
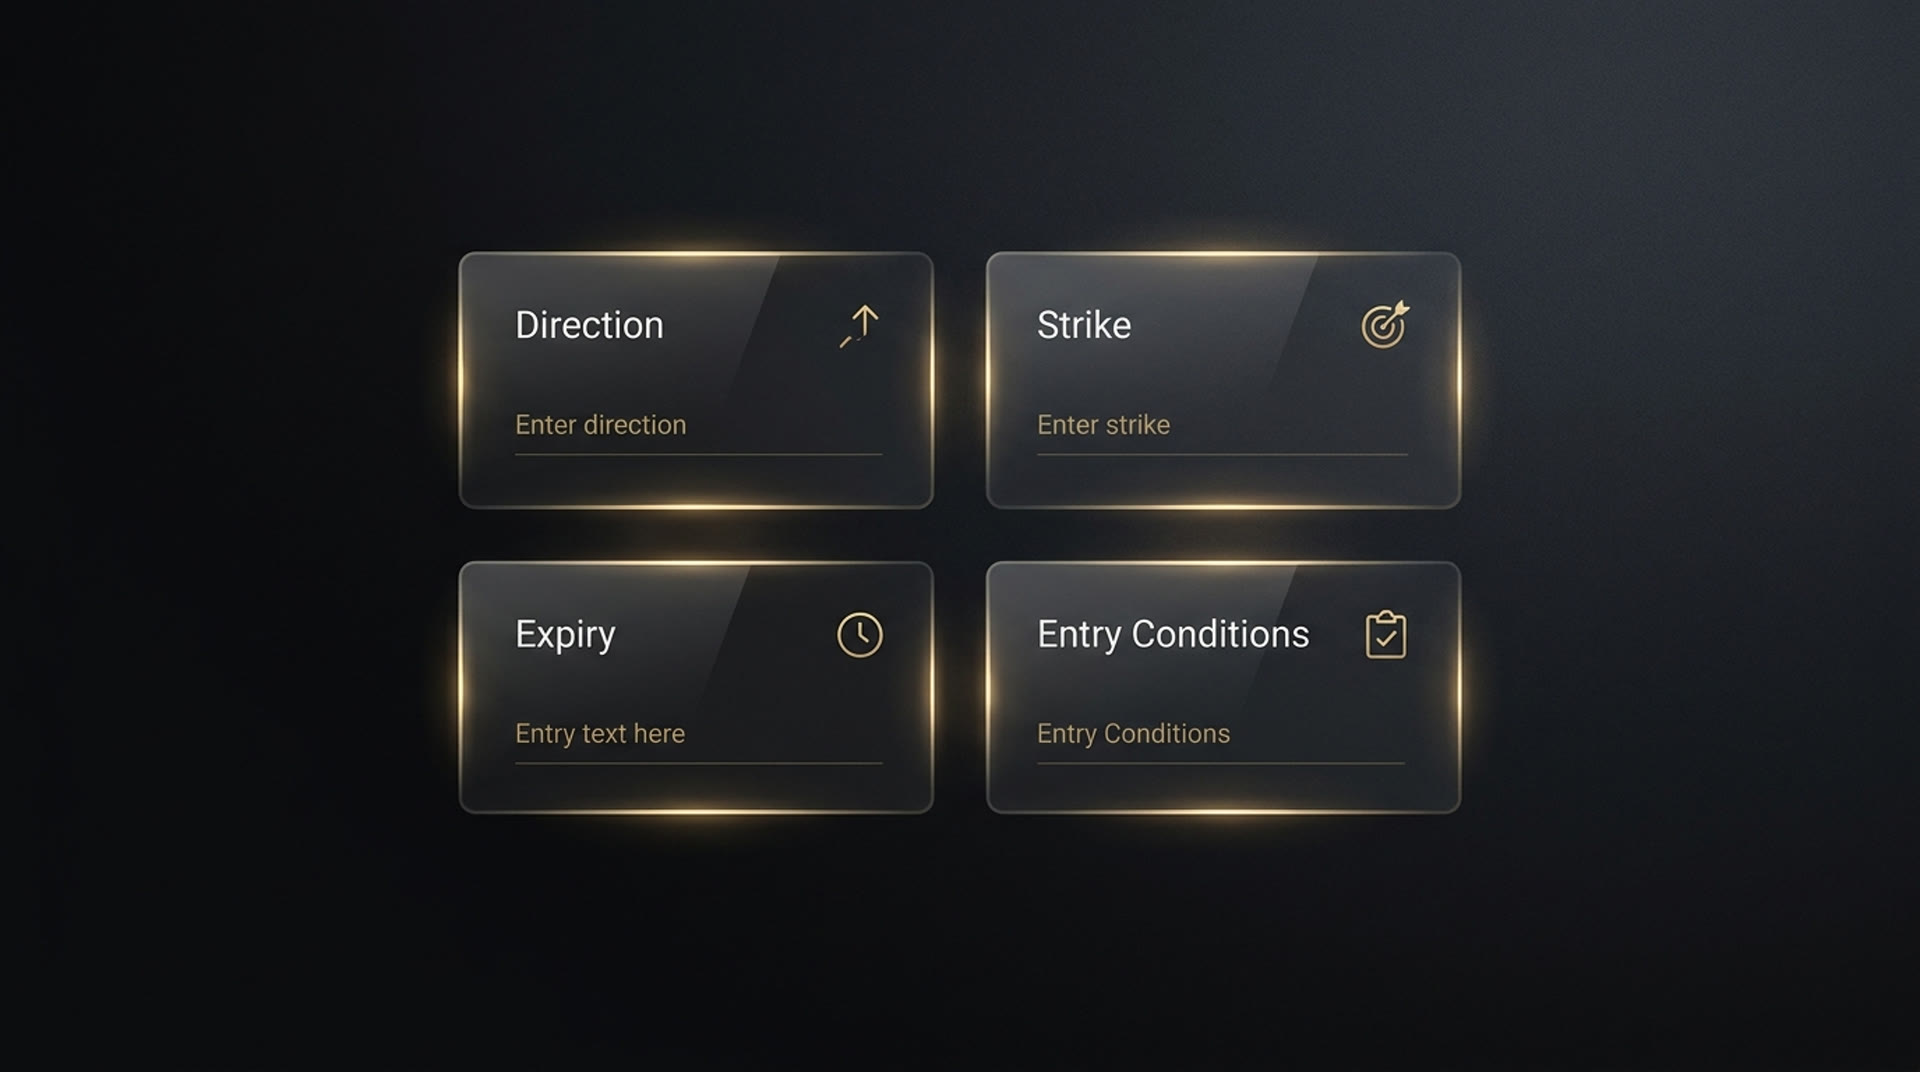
A threshold cross tells you where — not how long it takes to work. We use LEAPS, options 12+ months to expiration, so the position has room to recover and run instead of decaying while you wait.
At-the-money, slightly in-the-money, or a delta-target — every entry runs against the same three methods for comparison.
Long-dated by design. The pullback thesis needs runway, not a fast trade.
Technical threshold plus policy conviction. A pullback with no supporting signal is a lower-conviction setup — we flag it as one.
A threshold cross alone is a technicals-only setup. When it lines up with an active policy tailwind — a contract award, a committee markup, a disclosed trade in the sector — that's when it moves from watching to conviction.
| Ticker | ATH → Trigger | Pullback | Policy Layer | TBT Signal |
|---|---|---|---|---|
| META | Feb 2022 | -26.4% | Technicals-only | Watching |
| NVDA | Jan 2025 | -22.8% | Defense/AI spend | Confirmed |
| TSLA | Jan 2024 | -24.6% | Technicals-only | Watching |
| AMZN | FY 2022 | -51.0% | Gov't cloud contracts | Confirmed |
Pick a threshold, pick a ticker, see every historical pullback that would have triggered — and what it would have paid, shares versus LEAPS, dollar for dollar. Get early access to the simulator.